Non-Linear Demand Curve Analysis: Jacob Bernoulli’s Method

Demand Curve is a downward slop and not a straight line. In economics, ‘demand‘ relates to the desire of people to purchase something and the willingness to pay for it. The law of demand explains the functional relationship between the price of a commodity and its demand. The most important tool that explains this relationship is the demand curve. This curve is always downward sloping due to an inverse relationship between price and demand.
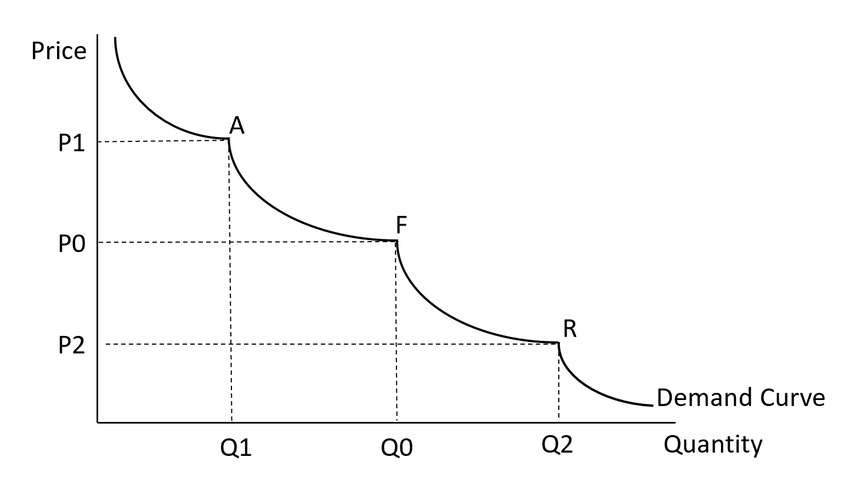
According to the economic theory, the demand curve should be downward sloping and is usually drawn. While the downward sloping shape is generally a true representation, price surveys usually indicate that demand for a product is not usually a linear function of its price, and so the demand curve is rarely linear. As shown in Figure, the demand curve usually resembles a series of waves rather than a straight line.
In the non linear or curvilinear demand function, the slope of the demand curve (ΔP/ΔQ) changes along the demand curve. Instead of a demand line, non-linear demand function yields a demand curve.
A non-linear demand equation is mathematically expressed as:
Dx = (a/Px + c) b, where a, b, c > 0

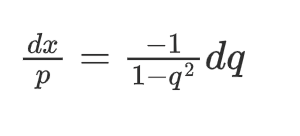
The goal of Jacob Bernoulli’s method is to construct a curve y(x) satisfying the differential equation which shows demand curve is not a straight line.
let AC be fixed and AE = CG = x, and consider the triangle GHD associated with the tractrix HI. If we label its sides GH = p and GD = u, the other leg is p2−u2. In the initial position u = 0 and p = GH = DH.
As always with a tractrix, its differential triangle is similar to the finite triangle GHD, which gives the differential equation:

This equation simplifies by taking u/p to be a new variable, u/p = q. Then u = pq, so that du = q dp + p dq. The equation then becomes

which split into partial fractions becomes

Thus by integrating, we get equation that verify that Demand Curve is a non-linear curve rather than a straight line.
Causes for Downward Sloping of Demand Curves
1) The law of diminishing the marginal utility: According to this principle, the marginal utility of a commodity reduces when the quantity of goods is more. Consequently, when the quantity is more, the prices will fall and demand will increase. Hence, consumers will demand more goods when prices are less. This is why the demand curve slopes downwards.
2) Substitution effect: Consumers often classify various commodities as substitutes. For example, many Indian consumers may substitute coffee and tea with each other for various reasons. When the price of coffee rises, consumers may switch to buying tea more as it will become relatively cheaper. Economists refer to this as the substitution effect. Hence, if the price of tea reduces, its demand will increase and the demand curve will be downward sloping.
3) Income effect: According to this principle, the real income of people increases when the prices of commodities reduce. This happens because they spend less in case of falling prices and end up with more money. With more money, they will, in turn, purchase more and more. Therefore, the demand increases as prices fall.

Professor Jacob S. Richer
is an astrophysicist with expertise in the field of star formation, with a particular in interest in radio and submillimetre observations of young stars and protostellar systems. He has held a Junior Research Fellowship at Queens' College, Cambridge; a Royal Society University Research Fellowship, and he is currently Professor of Physics in the Astrophysics Group at the Cavendish Laboratory.
Popular pages on Priceo:
